IC Markets Home Assinar em Web Trader Contacte-nos
IC Markets Social IC Markets Social

Centro de Informação para
Traders Sérios

  • Sobre nós
  • ABRA UMA CONTA DE NEGOCIAÇÃO
  • TESTE UM DEMO GRATUITO
  • Comece a Operar
  • Visite nosso blog
IC Markets Social
  • Sobre nós
  • ABRA UMA CONTA DE NEGOCIAÇÃO
  • TESTE UM DEMO GRATUITO
  • Comece a Operar
  • Visite nosso blog
December 11, 2023Australian_Stocks_enIC Markets

Either a rebound or a breakout imminent on FTSE China A50 Index

FTSE China A50 Index is moving towards a support line. Because we have seen it retrace from this line before, we could see either a break through this line, or a rebound back to current levels. It has touched this line numerous times in the last 18 days and may test it again within the […]

Read more
December 10, 2023Australian_Stocks_enIC Markets

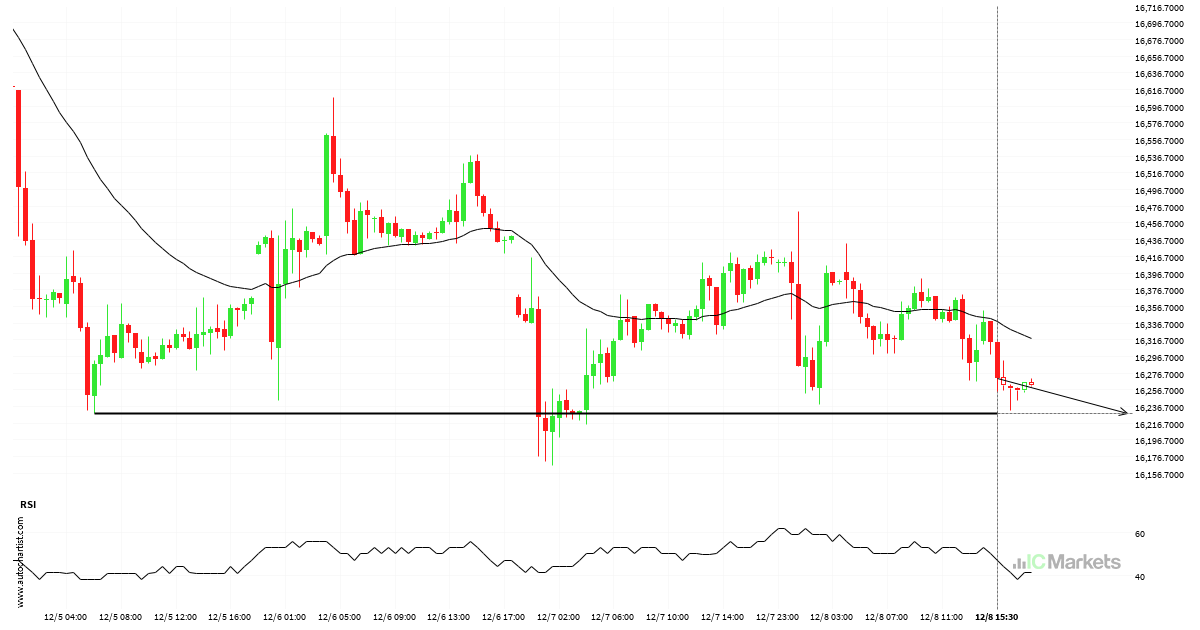
Hong Kong 50 Index is on the approach

Hong Kong 50 Index is moving towards a line of 16228.5000 which it has tested numerous times in the past. We have seen it retrace from this position in the past, so at this stage it isn’t clear whether it will breach this price or rebound as it did before. If Hong Kong 50 Index […]

Read more
December 8, 2023Australian_Stocks_enIC Markets

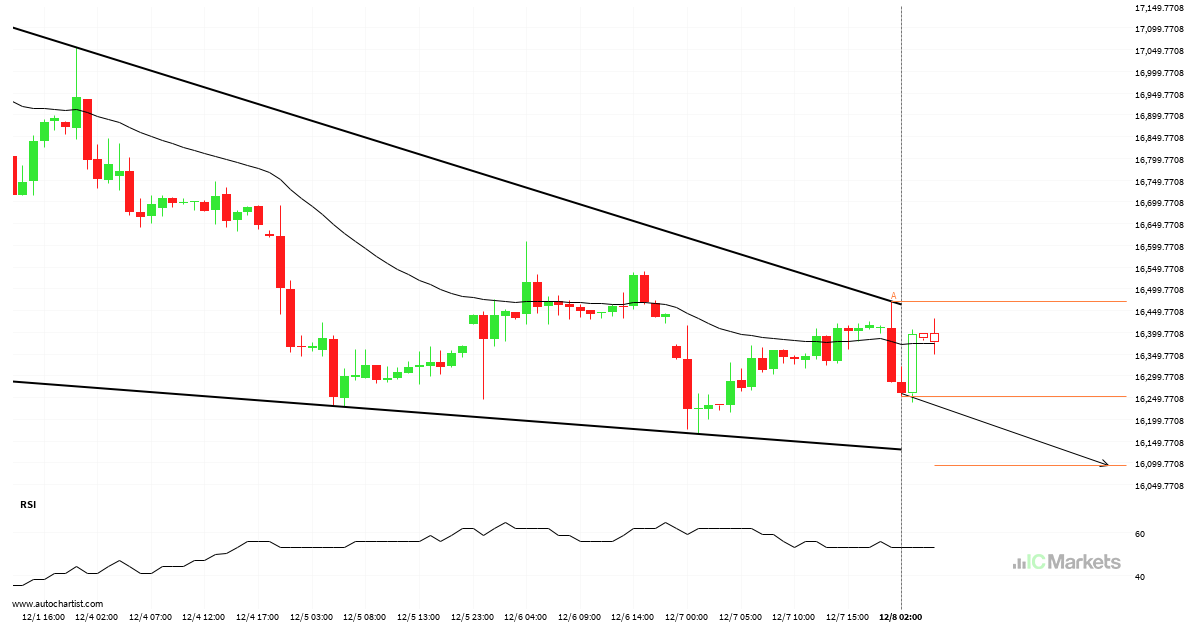
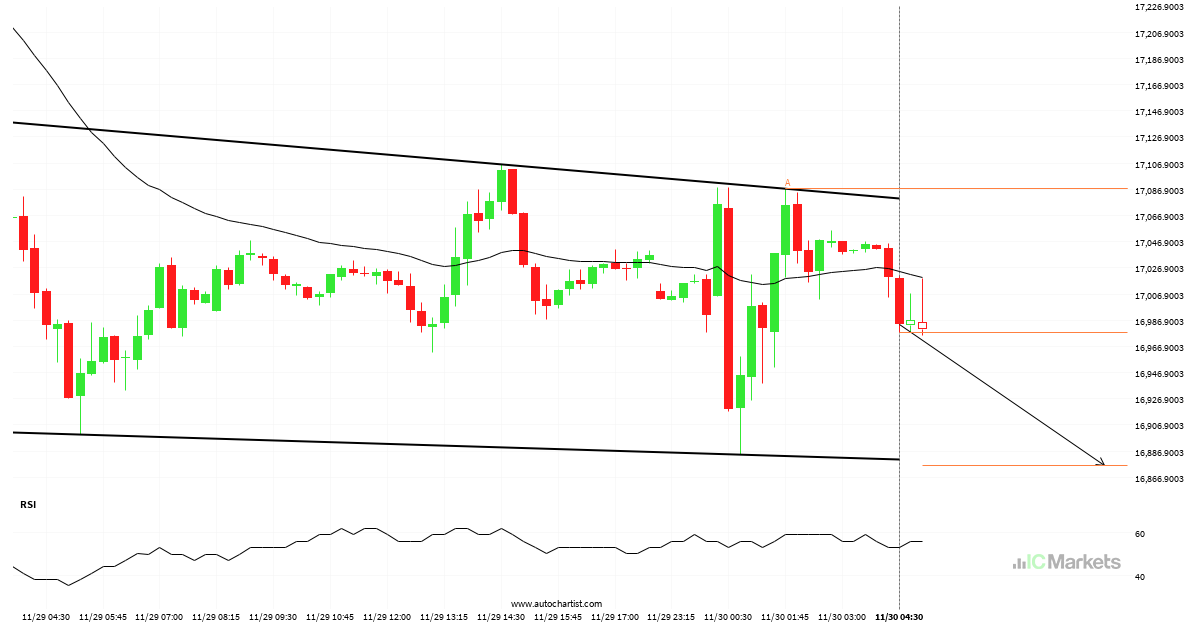
Hong Kong 50 Index – Reversal Chart Pattern – Falling Wedge

A Falling Wedge pattern was identified on Hong Kong 50 Index at 16252.5, creating an expectation that it may move to the support line at 16094.6364. It may break through that line and continue the bearish trend or it may reverse from that line.

Read more
December 7, 2023Australian_Stocks_enIC Markets

Possible breach of support level by Hong Kong 50 Index

Hong Kong 50 Index is moving towards a support line. Because we have seen it retrace from this line before, we could see either a break through this line, or a rebound back to current levels. It has touched this line numerous times in the last 14 days and may test it again within the […]

Read more
December 6, 2023Australian_Stocks_enIC Markets

Huge movement on FTSE China A50 Index, did you miss it?

FTSE China A50 Index has moved lower by 7.43% from 12208.43 to 11300.9 in the last 32 days.

Read more
December 4, 2023Australian_Stocks_enIC Markets

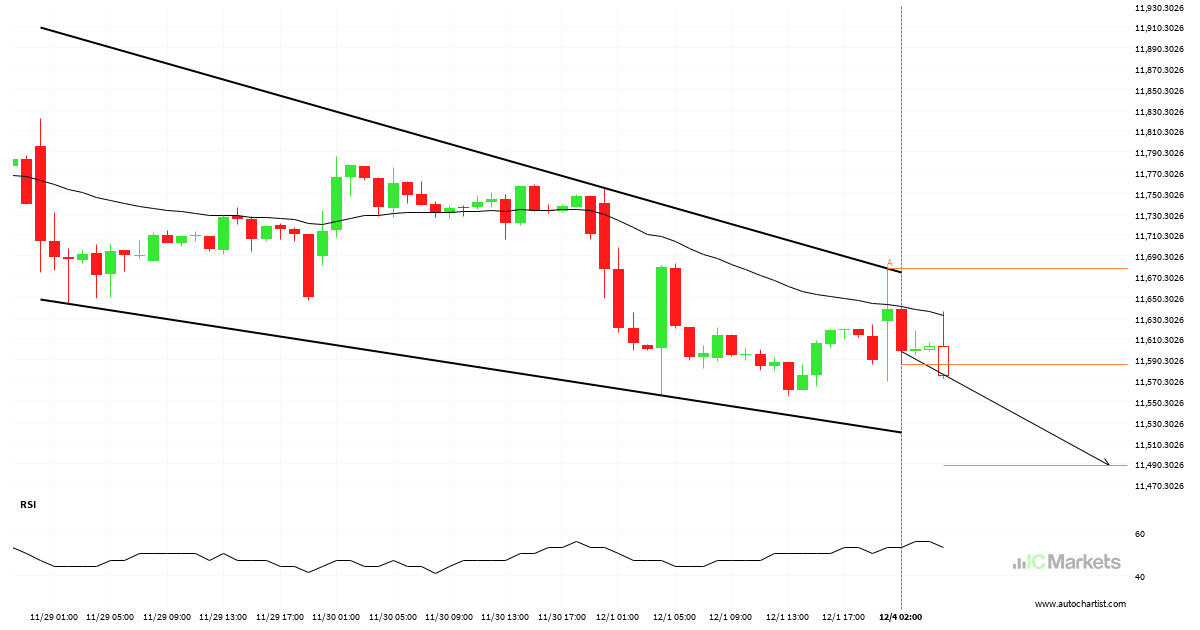
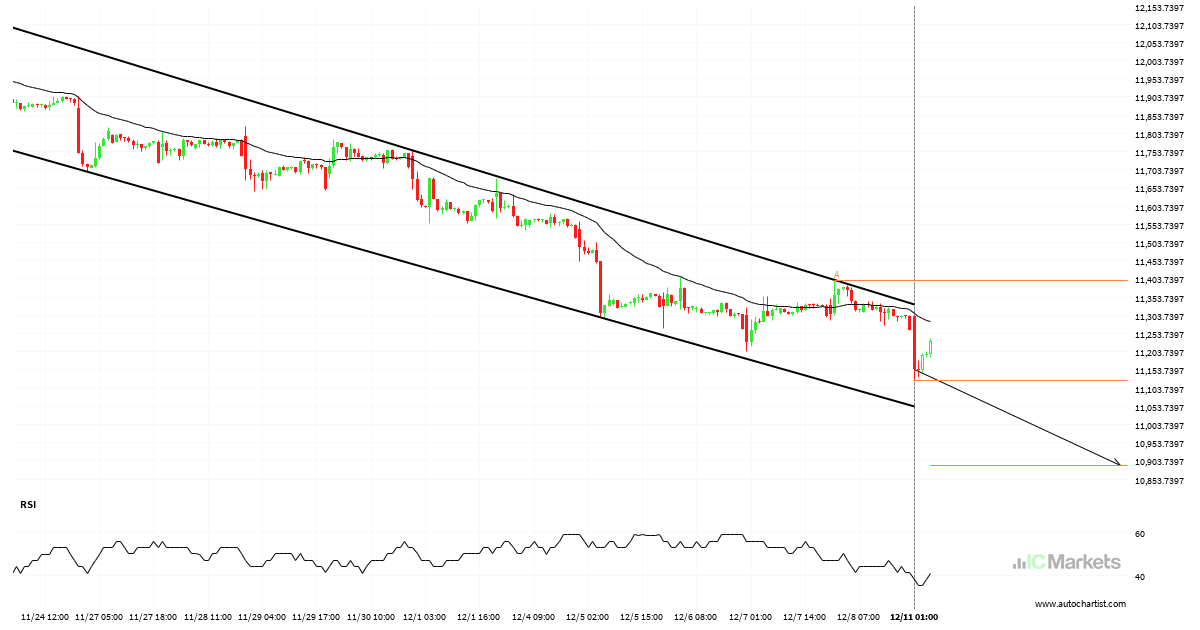
Should we expect a breakout or a rebound on FTSE China A50 Index?

FTSE China A50 Index is heading towards the support line of a Falling Wedge. If this movement continues, the price of FTSE China A50 Index could test 11489.0372 within the next 16 hours. It has tested this line numerous times in the past, so this movement could be short-lived and end up rebounding just like […]

Read more
December 3, 2023Australian_Stocks_enIC Markets

What’s going on with Australia 200 Index?

Australia 200 Index dropped sharply for 21 hours – which is an excessively big movement for this instrument; exceeding the 98% of past price moves. Even if this move is a sign of a new trend in Australia 200 Index there is a chance that we will witness a correction, no matter how brief.

Read more
November 30, 2023Australian_Stocks_enIC Markets

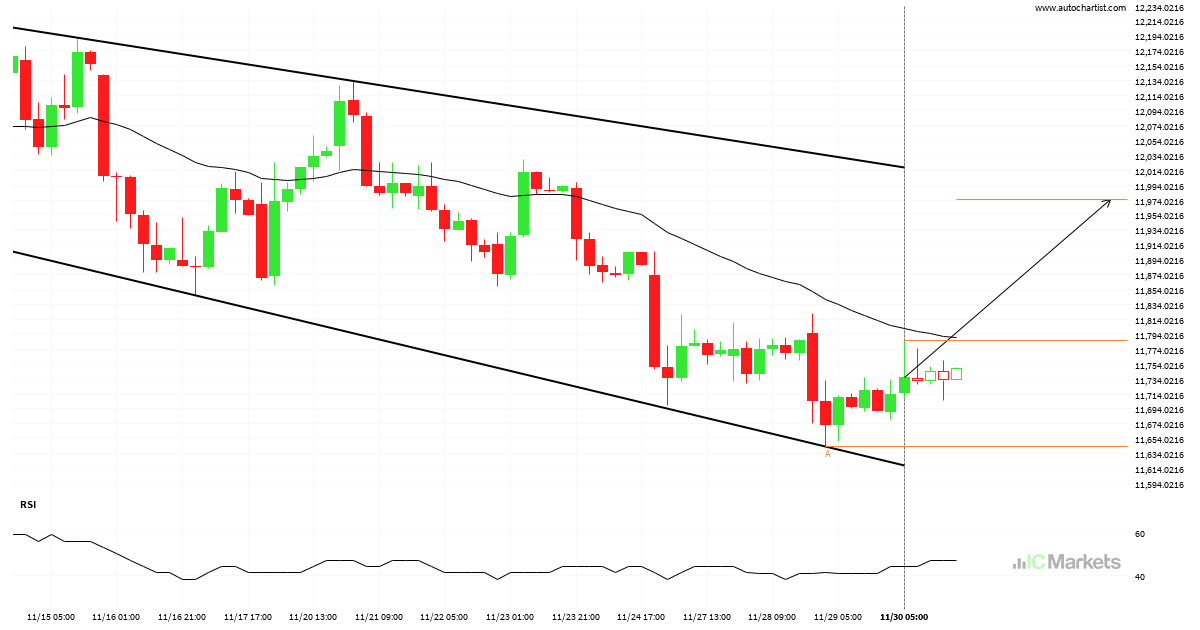
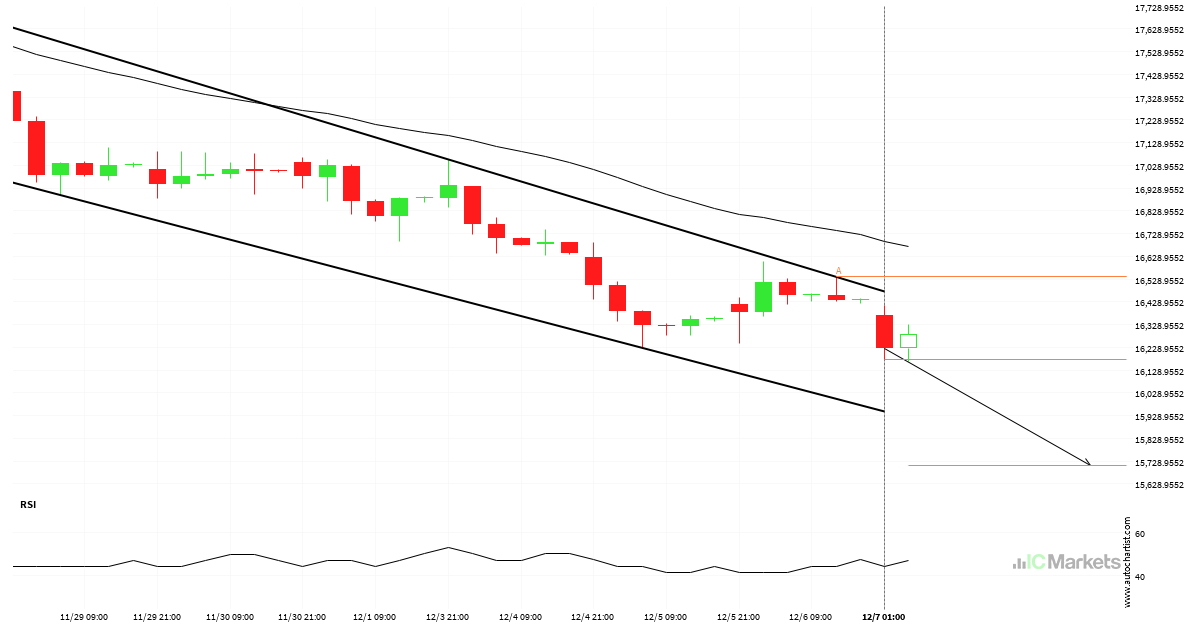
FTSE China A50 Index – getting close to resistance of a Channel Down

Emerging Channel Down detected on FTSE China A50 Index – the pattern is an emerging one and has not yet broken through support, but the price is expected to move up over the next few hours. The price at the time the pattern was found was 11785.49 and it is expected to move to 11974.4925.

Read more
November 30, 2023Australian_Stocks_enIC Markets

Should we expect a breakout or a rebound on Hong Kong 50 Index?

Hong Kong 50 Index is trapped in a Descending Triangle formation, implying that a breakout is Imminent. This is a great trade-setup for both trend and swing traders. It is now approaching a resistance line that has been tested in the past. Divergence opportunists may be very optimistic about a possible breakout and this may […]

Read more
November 29, 2023Australian_Stocks_enIC Markets

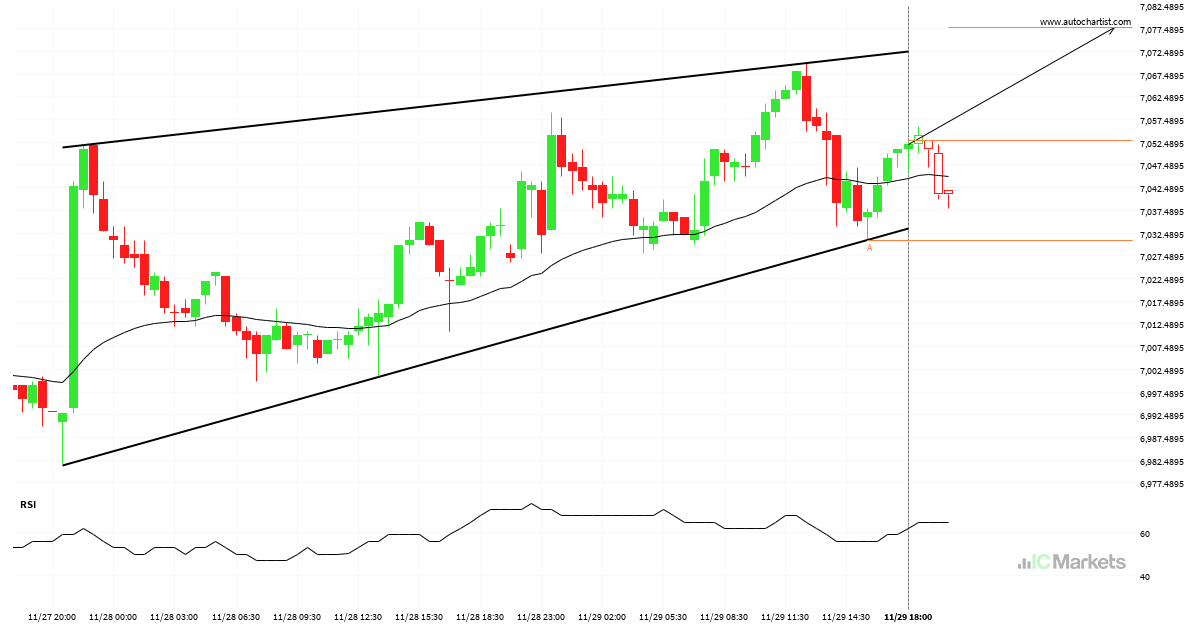
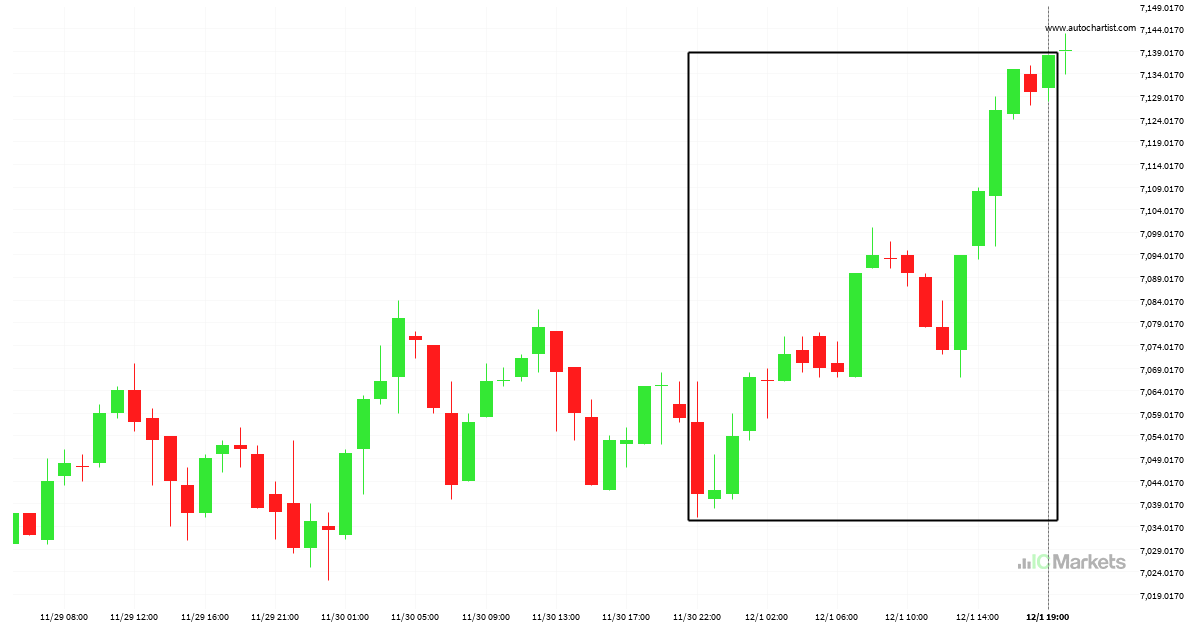
Australia 200 Index approaching resistance of a Rising Wedge

Australia 200 Index is heading towards the resistance line of a Rising Wedge. If this movement continues, the price of Australia 200 Index could test 7077.6759 within the next 11 hours. It has tested this line numerous times in the past, so this movement could be short-lived and end up rebounding just like it did […]

Read more
  • 1
  • 2
  • 3
  • …
  • 22
  • 23
  • 24
  • 25
  • 26
  • 27
  • 28
  • …
  • 153
  • 154
  • 155

Recent Posts

  • Either a rebound or a breakout imminent on SILVER
  • GOLD Nível visado: 2976.3601
  • A potential bearish movement on GOLD
  • มีโอกาสเกิดการเคลื่อนตัวแบบ bearish บน GOLD
  • Posible gran movimiento en el AUDJPY

Recent Comments

    Translation


     Edit Translation

    Negocie com um

    líder de mercado no qual possa confiar

    ABRA UMA CONTA DE NEGOCIAÇÃO TESTE UM DEMO GRATUITO

    Trading com Forex

    • Visão Geral de Contas
    • Abrir uma Conta
    • Lançar Web Trader

    Especificações de Trading

    • Spreads e Comissões
    • Gama de Mercados
    • Horas de Trading
    • Financiamento
    • Levantamento

    Acerca da IC Markets?

    • Help Center
    • Porquê a IC Markets
    • Regulamentação
    • Documentos Legais
    • Contacte-nos


    Forex Trading

    • Accounts Overview
    • Open an Account
    • Launch Web Trader

    Trading Specifications

    • Spreads and Commissions
    • Range of Market
    • Trading Hours
    • Funding
    • Withdrawal

    About IC Markets

    • Chat with a Specialist 24/7
    • Why IC Markets
    • Regulation
    • Legal Documents
    • Contacte-nos

    Isenção de Responsabilidade: Este material corresponde a material de marketing em que todo o material de marketing é publicado apenas para fins informativos. Este material não contém e não deverá ser considerado como contendo - aconselhamento de investimento e recomendações ou sugestões para adotar quaisquer ações relativamente a instrumentos financeiros. Os widgets incorporados pertencem aos seus autores externos independentes e a IC Markets não é responsável pelo seu conteúdo ou pelo seu impacto na negociação.

    Todos os direitos de conteúdo reservados. As opiniões dos autores poderão não coincidir com a opinião dos editores do blog. Aquando da cópia de materiais a partir deste site ou aquando da ligação ao RSS feed, para republicar os nossos artigos, é necessário um link para a IC Markets ou a atribuição no formato 'IC Markets Blog'. Para questões gerais, por favor, entre em contato com a agência editorial através do formulário da nossa página de Contato.

    Alerta de Risco: A negociação de Derivados acarreta um elevado nível de risco para o seu capital e deverá negociar apenas com dinheiro cuja perda possa suportar. A Negociação de Derivados poderá não ser adequada para todos os investidores e, como tal, por favor, certifique-se de que entende plenamente os riscos envolvidos e procure aconselhamento independente, se necessário. Deverá ser considerada uma Declaração de Divulgação de Produto (PDS) antes de efetuar uma transação connosco.

    O conteúdo desta página corresponde apenas a informação geral e não tem em conta a sua situação pessoal, objetivos ou necessidades financeiras. Cabe-lhe a si certificar-se de que os produtos que nós oferecemos se adequam às suas necessidades específicas. Não deverá negociar connosco, a menos que entenda as caraterísticas e os riscos dos produtos que nós oferecemos. Isto significa que poderá precisar de procurar aconselhamento independente antes de começar a negociar connosco.

    © 2022 Raw Trading Ltd | All rights reserved.
    • Sample Page